


Why Bottom-Up Data Beats Top-Down Estimates for Transit Market Project Pursuits
In public transit, the distance between a funding announcement and a shovel in the ground is rarely linear. National plans, multi-year bills, and high-level forecasts create an impression of inevitability; yet, at project level, delay, redesign, and cancellation are common. The question, then, is not whether the money exists in aggregate, but which specific projects will advance, on what timetable, and with whom. That is precisely where bottom-up data outperforms top-down estimates.
The limits of top-down comfort
Top-down approaches are intellectually tidy. Analysts start with multi-billion-dollar infrastructure commitments, apply historical allocation ratios, and then infer likely spending by mode or geography. Such estimates are comforting, not least because they reduce complex institutional behaviour to a single number that fits neatly in a slide deck. But comfort is not the same as accuracy.
For engineering and consulting firms, top-down comfort can be costly. A buoyant national forecast may disguise a reality in which only a thin slice of projects are genuinely contestable over the next few years, with many others stalled in environmental review, constrained by local match, or politically contentious. Transit agencies, too, may overestimate how quickly they can convert authorisations into procurements, leading to misaligned expectations with partners and the public.
What bottom-up actually reveals
Bottom-up data begins at the other end of the telescope. It treats each project, each procurement, each award decision as a discrete observation in a wider market, and then aggregates upwards. A feasibility study for a BRT corridor, a design–build tender for a maintenance facility, a planning grant for zero-emission buses—each is a small, concrete signal of intent that can be tracked over time.
When thousands of such signals are collected systematically, a different picture emerges. Instead of a single national growth figure, one sees a textured landscape: which transit agencies are reliably converting studies into procurements, which regions are experimenting with public–private partnerships, which firms are capturing repeat work, and where competition is intensifying or thinning. For both private firms and public owners, this granularity matters more than an abstract growth rate.
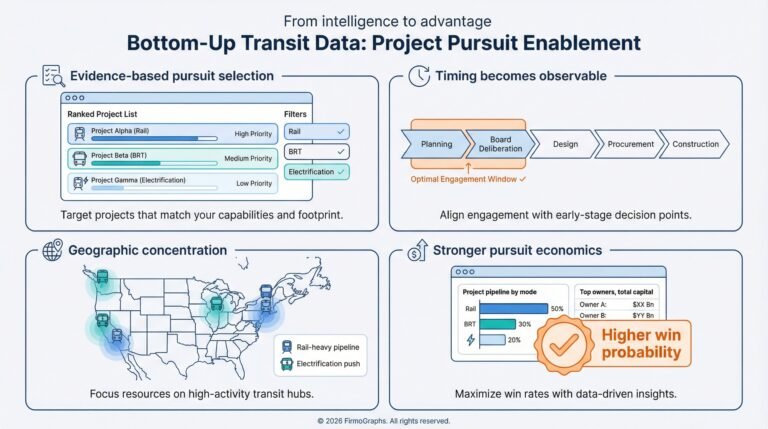
From intelligence to advantage
The economic value of bottom-up intelligence is straightforward: it allows scarce resources—capital, technical talent, political capital—to be allocated toward the most probable, highest-impact opportunities.
For engineering and consulting firms, this means:
- Prioritising pursuits where project history, funding signals, and agency behaviour suggest a high likelihood of near-term procurement.
- Anticipating shifts in delivery models (for example, toward design–build or progressive design–build) based on observed patterns, not conjecture.
- Understanding competitors’ footprints and specialisations through award histories, rather than anecdote.
For transit agencies, the same data underpins better strategy:
- Benchmarking their own project delivery performance against peers, using observable milestones rather than self-reported narratives.
- Identifying where market interest is strong or weak, helping to shape packaging strategies, contract sizes, and risk allocations.
- Communicating more credibly with boards and the public about what is likely to be delivered, and when.
In both cases, the operative shift is from planning based on averages to planning based on evidence.
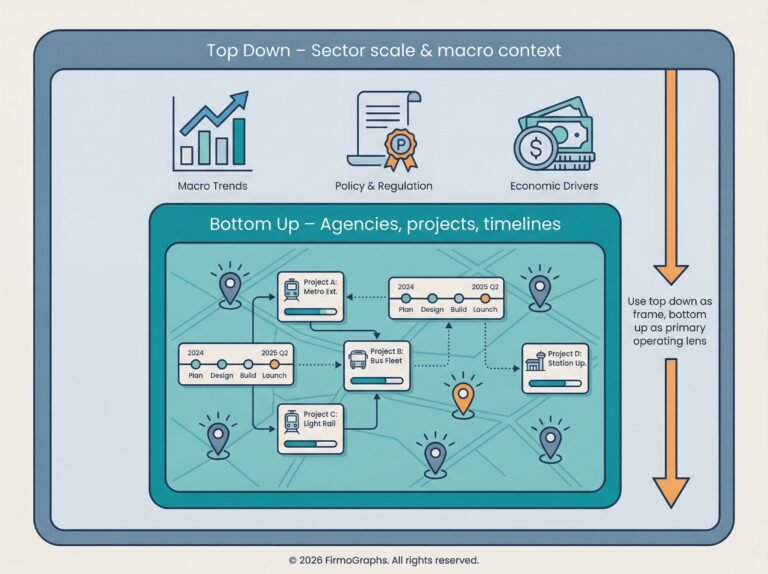
Completing, not discarding, top-down views
None of this implies that top-down estimates are useless. They remain helpful for framing the overall fiscal context and for high-level scenario planning. But in an environment where pursuit costs are high, staff time is constrained, and political expectations are unforgiving, top-down views are no longer sufficient.
The more sophisticated strategy is to treat top-down forecasts as hypotheses, and bottom-up evidence as the test. For organisations competing in, or governing, the modern transit market, that discipline is increasingly the difference between wishful thinking and executable plans.
Why Firmographs is built for bottom-up transit strategy
Firmographs starts from the same premise as any serious economist of infrastructure: what matters is not the promise of spending, but the observable behaviour of institutions over time. By systematically gathering and structuring public information on transit projects, owners, and awards, Firmographs applies a bottom-up lens to the heavy infrastructure and transportation markets that would be prohibitively labour-intensive to replicate by hand.
For engineering and consulting firms, this means turning a scattered trail of board packets, planning studies, and procurement notices into a coherent, searchable view of where real opportunity is emerging. For transit agencies, it means seeing themselves in context—understanding how peers are sequencing projects, engaging the market, and attracting competition—and using that knowledge to design more bankable, more deliverable programmes.
In effect, Firmographs operationalises the bottom-up approach described above: replacing generic “market size” slides with a living map of specific transit projects, their status, and their likely trajectories. For teams deciding which pursuits to fund, which partners to cultivate, or which projects to accelerate, that is not a cosmetic refinement. It is the informational foundation for better bets in a capital-intensive, politically exposed industry.